Running PyDome
- Install Python. The code was developed under Python 2.7. Packages for all operating systems (Windows/Mac/Linux) are available from http://www.python.org/getit/
- Create a directory under your users home directory and copy all the PyDome files there. This will be where you run the script from and save the output to.
- Update the 'config.py' script to set the dome diameter and the geodesic frequency.
- Run the 'geo.py' script from the command line. The default output is to
print the results on the screen, so to save it to a text file just
redirect the output:
python geo.py > output.txt
An
average desktop PC should take around 45 seconds to run for a 6V
sphere, with lower frequency calculations taking even less time.
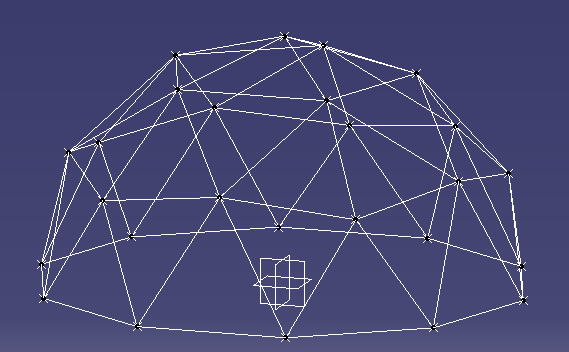 |
| 2V Dome results in CAD |
Output
The output consists of the list of points with Cartesian coordinates:
/*****************************
* Points
/*****************************
Pt77 = (-3782.10808464, 129.73646238, 4656.05271517)
Pt246 = (5547.56463791, 1201.67534466, 1944.35155109)
Pt112 = (4854.10196625, 3526.71151375, 0)
Pt402 = (1854.10196625, 4253.25404176, -3804.22606518)
Pt165 = (-571.430583503, -5647.38560167, -1944.35155109)
As well as the list of edges showing both endpoints and their coordinates:
/*****************************
* Edges
/*****************************
Point Pt77 Edge List:
------------------------------
Edge187: Pt74 = [ -3000.0, 974.759088699, 5103.90485011] - Pt77 = [ -3782.10808464, 129.73646238, 4656.05271517]
Edge188: Pt77 = [ -3782.10808464, 129.73646238, 4656.05271517] - Pt76 = [ -3917.72834195, 1272.94710279, 4362.45462008]
Edge200: Pt77 = [ -3782.10808464, 129.73646238, 4656.05271517] - Pt75 = [ -2736.75911987, -209.918005711, 5335.36165135]
Edge202: Pt83 = [ -3464.10161514, -1125.55484451, 4767.92683375] - Pt77 = [ -3782.10808464, 129.73646238, 4656.05271517]
Edge203: Pt79 = [ -4618.03398875, 449.02797658, 3804.22606518] - Pt77 = [ -3782.10808464, 129.73646238, 4656.05271517]
Edge204: Pt77 = [ -3782.10808464, 129.73646238, 4656.05271517] - Pt84 = [ -4428.16927497, -759.490479512, 3976.74377899]
Generated code for CAD Programs
It
is easy to modify the code to generate output in a format which can be
easily used in a CAD program. I have used CATIA for my examples, as it
can run Visual Basic macros to do tasks. I simply created a macro which
recorded the creation of two points and a line between them for an edge.
Then I added the function ‘Get_CATIA_Desc’ to the Coordinates and Edges
classes to print out the data with the right text. To generate all the
points and edges in a CATIA part I just copy and paste this output into
the VB editor and run the script.
Sample VB code to create a point in CATIA:
Set hybridShapePointCoord369 = hybridShapeFactory1.
body1.InsertHybridShape hybridShapePointCoord369
part1.InWorkObject = hybridShapePointCoord369
part1.Update
Program Structure
The advantage of using a language like Python is the Object Oriented (OO) nature of the language, which enables the code to reflect the structure. The objects which are modelled are the geodesic sphere (GeoSphere.py), icosahedron faces (IcoFace.py), edges, (Edge.py), and coordinates/points (Coordinates.py). The main GeoSphere class keeps track of a list of all the points and edges.Algorithm
Each face of the icosahedron has known coordinates, as determined from the equations in Platonic Solids Tutorial. Given these coordinates we can process each of the 20 faces at a time and use vector maths to calculate the delta vectors from a starting point A to the other two corners B and C. The location of each of the intermediate points can then be determined by scaling the delta vectors according to the frequency, and then iterating to get each row and column.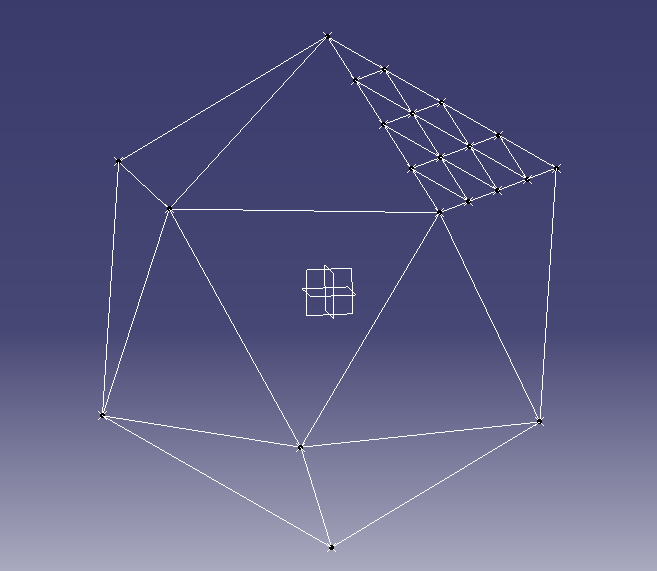 |
| Icosahedron with one face divided for a 4V geodesic sphere |
For example a frequency 4 dome would have each face divided into 4 rows and 4 columns.

The scaled delta vectors would then be calculated as:

With one counter for the row number and one for the column number, we can start at point A and use a loop over these counters to determine each point.
for i in range(0,self.freq_n+1): -- Row number
for j in range( 1, self.freq_n - i + 1): -- Column number
# Calculate the new coordinates based on the offset from the initial point (A)

As
each face is added to the GeoDome class the coordinates from each face
are added to the global list. Once all faces have been added then the
list can be checked for duplicate points, as any points on the line
where two faces meet will be doubled up.
The
final step is to project each point onto the sphere. So far all the
calculations have been in Cartesian coordinates (x,y,z), however the
Coordinates class also keeps the polar coordinates (theta, phi, r). Each
point will then have its polar coordinates radius (‘r’) set to the same
value while keeping the angles theta and phi the same. Setting the
radius will also recalculate the Cartesian coordinates for each point.
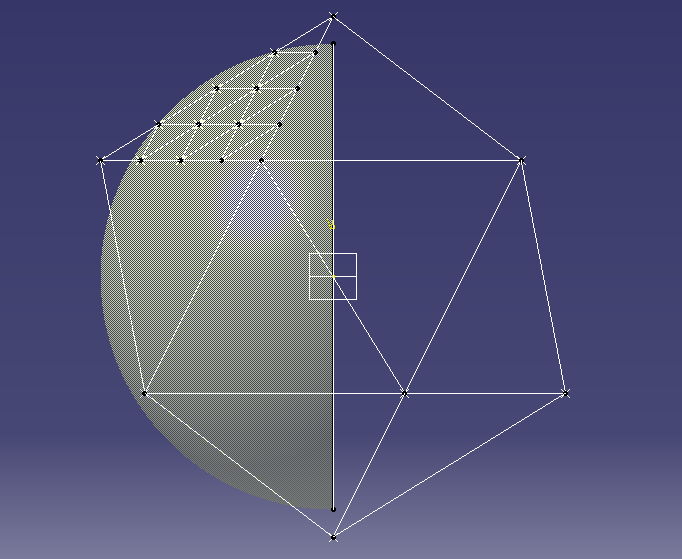 |
| Icosahedron with sphere for projecting points |
Advanced Modifications
The user parameters are defined in a small section at the beginning of the 'geo.py' script. Currently there are three parameters, the frequency of the geodesic (frequency_n), the radius of the dome (R_mm), and a flag for sphere or dome calculations. The coordinates should be entered in mm as this gives better readability in the final results.
To calculate the coordinates of a 6 metre (6000mm) radius dome of frequency 6, set these variables to the corresponding values as shown:
To calculate the coordinates of a 6 metre (6000mm) radius dome of frequency 6, set these variables to the corresponding values as shown:
R_mm = 6000
frequency_n = 6
Dome_calc = True
Dome_calc = True
There
are potentially lots of different methods of dividing the faces of the
icosahedron. Traditional geodesic domes or spheres divide each flat face
into equal lengths. When the points are projected onto
the
sphere they then have different lengths. An alternative method is to
divide the arc between the edge vertices into equal angles. In order to
change the calculation method for each face,
modify
the file GeoSphere.py in the function Add_Face. This section of the
code takes the 3 corner vertices and then calculates all the points
within that face. Just replace the function 'Get_Edges_Equal_Distance'
with an equivalent function.
#-----------------------------
# Use this function to divide faces by equal distance
#
edge_list = F1.Get_Edges_Equal_Distance()
To Do List
For each hub point calculate the angle of at which each edge meets at the hub. This would be both the angle between the edges and the angles of the edge from a flat plane.
Read with interest your post on dome points calculations, wondering if you had implemented finding the face angle calculations required for accurate hub construction. Thank you.
ReplyDeleteHi, at this point in time I havent added that step in. I got as far as working out the logic in terms of the vector calculations, but not as far as implementing it. Basically for each point there is the vector from (0,0,0) to (x, y, z). Then I would calculate the two vectors which are both at right angles to that vector to define the plane which is perpendicular to it. Then the angle that I am interested in would be the angle between that plane and the 5 or 6 arms which leave that hub point. So what I am intending to get is the ability to calculate the angles necessary to be able to then make the brackets for each hub point. Hope that makes sense. Im not sure when I will be able to do this, but if I do I will let you know. Otherwise if you have any suggestions for improvements to the code please let me know!
ReplyDelete